More accurate heart rate
The heart rate is timed by the feet of the pulse wave, the moment each beat begins. The same way on the result, in the history, in exports and while measuring, so the numbers agree.
Place your fingertip on the camera, and in 30 seconds you know how your heart is doing. A research project at BUT Brno, validated against a Holter ECG.
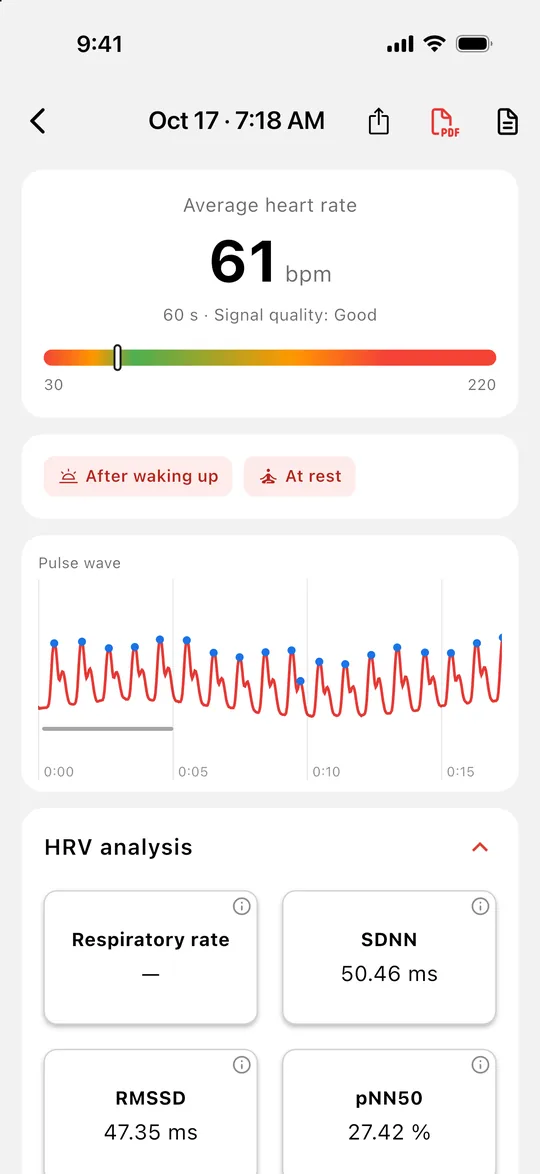
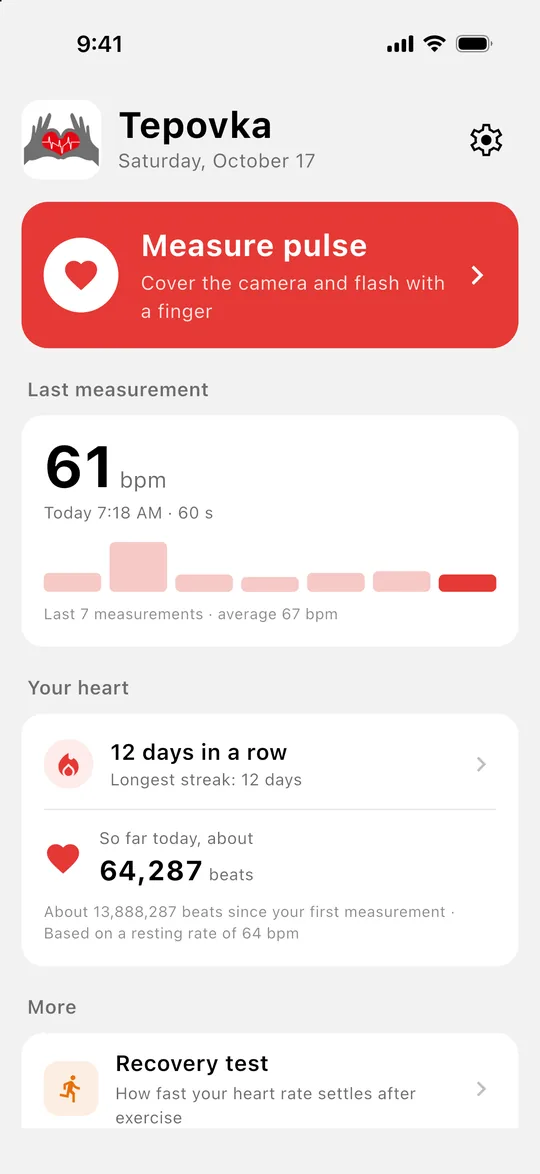
The biggest changes are under the hood: the heart rate is more accurate, and the app says so openly when a reading did not work.
The heart rate is timed by the feet of the pulse wave, the moment each beat begins. The same way on the result, in the history, in exports and while measuring, so the numbers agree.
When no heart rate can be found in a recording, the app says so and offers to measure again. Before, a stand-in value could take its place.
If the phone moves while measuring, “Keep still” appears. When the signal stays unsettled too long, the measurement runs 10 seconds longer.
A reading is graded “good” only when two independent ways of computing the heart rate agree. When they do not, the app explains why in one sentence.
A short bout of exercise and two minutes of measuring. It shows how far your heart rate fell after 1 and 2 minutes, and how that changes as you get fitter.
Your latest reading and trend right on the home screen. One tap starts a new measurement.
The screens are from the real app; the data on them are samples.
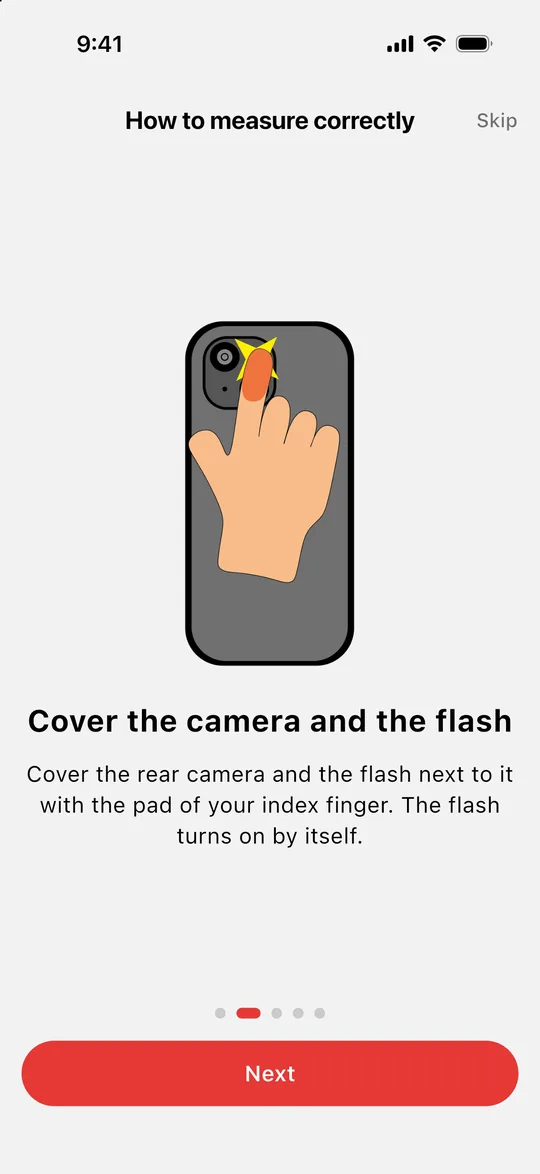
How to place your finger for a clean signal. The flash turns on by itself.
Every beat, signal quality, SDNN, RMSSD and more.
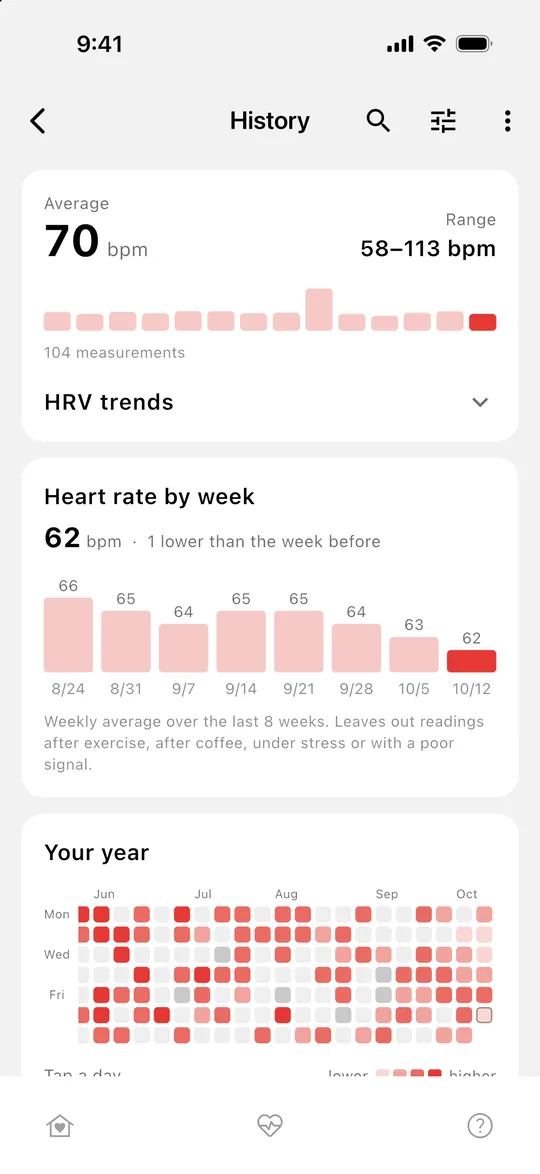
A weekly trend of your resting heart rate and a whole year in one calendar.
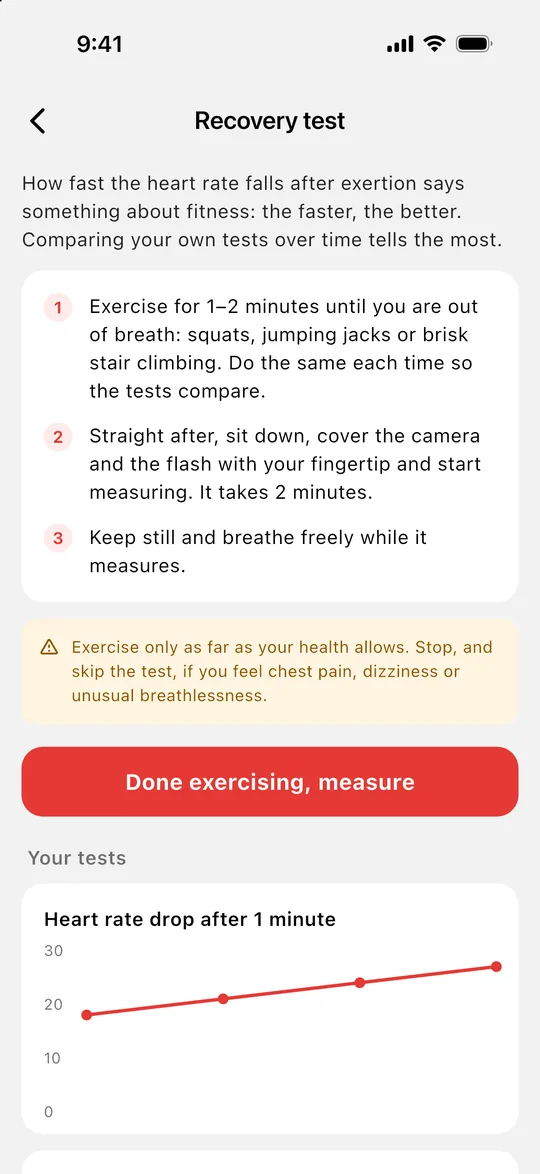
How far your heart rate falls after exercise, and how it changes with fitness.
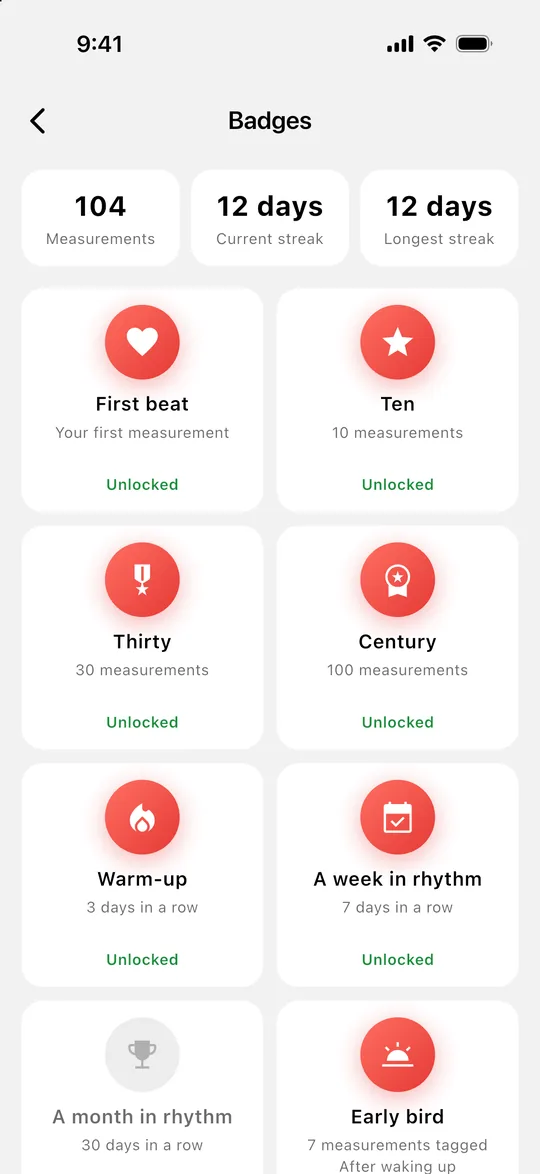
Make measuring a habit, with a reminder at the time you choose.
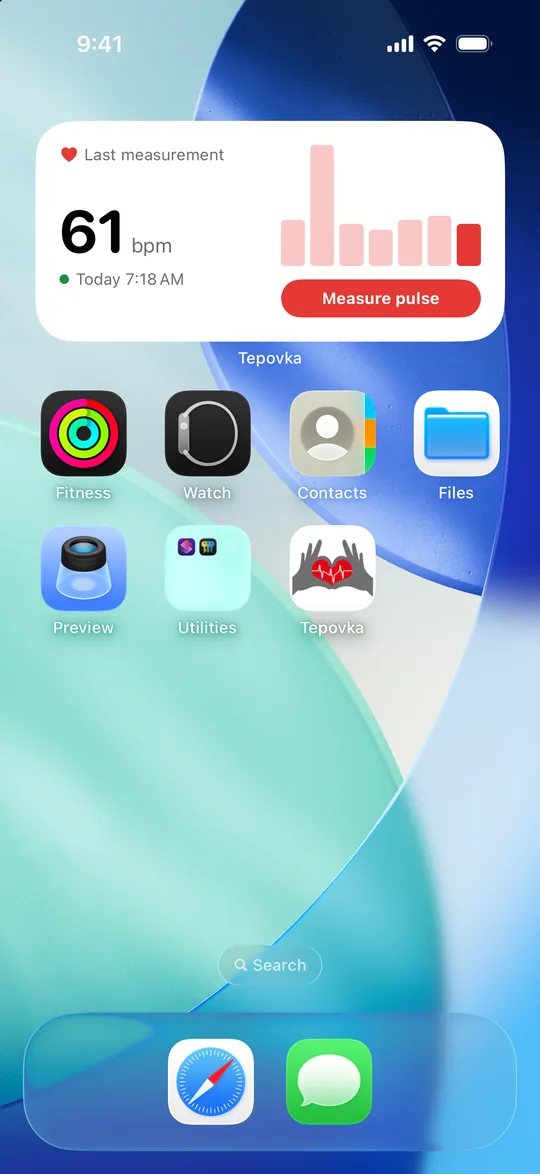
Your latest heart rate on the home screen. Save heart rate and HRV to Health.
Also: a PDF report for your doctor, export to CSV, JSON and TXT, and a senior mode with larger text and voice guidance.
With every heartbeat blood rushes into your fingertip and its colour changes slightly. The camera sees it, and the app turns it into your heart rate.
Each frame contributes the average of the green channel under your finger, or of red when green is weak. The app asks for 60 frames per second and stores the time of every frame, so the time base is measured, not assumed.
A detector finds where each pulse begins. The heart rate is the median interval between them. While you measure, the same detector reads the last 8 seconds, so the number on screen matches the result.
Quality comes from the spectral purity of the signal and the agreement of two ways of computing the heart rate. The beat intervals give the variability (SDNN, RMSSD, pNN50, SD1, SD2), and the recovery test the drop after exercise.
Most apps that measure heart rate with the camera have no validation, or do not show it. In August 2026 we measured 15 volunteers while a Bittium Faros 180 Holter ECG and a Nonin pulse oximeter recorded at the same time as the phone. That gave 61 simultaneous recordings, on which accuracy can be shown with a number rather than a claim.
1.25 bpm
Mean difference from ECG
Across 57 recordings with a good
reference.
93 %
Recordings within 5 bpm
Less than five beats per minute from the ECG.
3.0 bpm
On the public BUT PPG data
825 recordings rated good by experts.
Each participant wore the Holter ECG on the chest and the pulse oximeter on one hand, and measured with the phone using the other. The protocol was the same for everyone: three 30-second recordings at rest and one 90-second recording after exercise, so the data also cover a higher heart rate. The measured range is 51–112 bpm; participants were 20 to 47 years old.
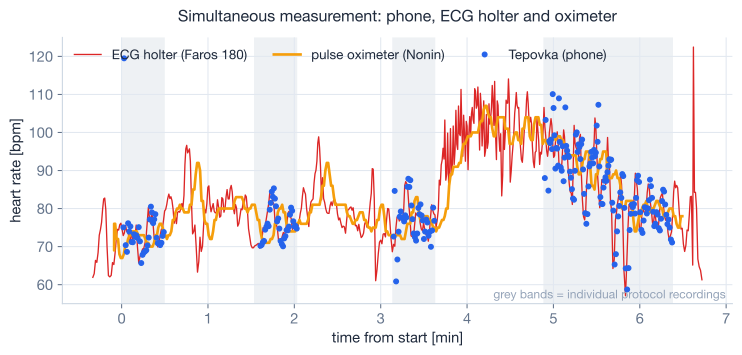
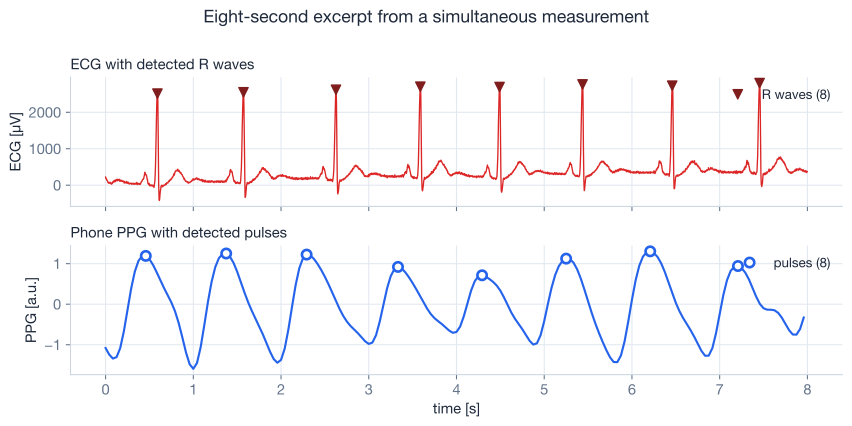
Accuracy does not rest on the average over a whole recording but on whether the app finds every single beat. The excerpt below shows the ECG with detected R waves on top and the phone camera signal with detected pulses below, one to one. Across the whole set the detector finds 99 % of the real beats.
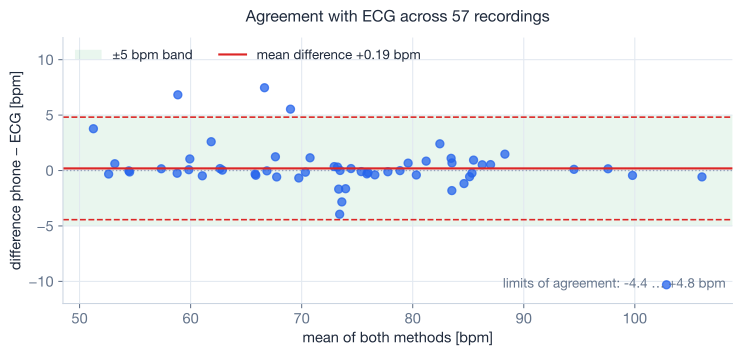
The chart shows the difference between the phone and the ECG for each recording, from the analysis for our paper: a mean difference of +0.2 bpm, a mean absolute error of 1.25 bpm, and nearly all recordings within ±5 bpm. For comparison: the Holter ECG and the pulse oximeter differed from each other by 2.0 bpm on the same data, so the app is within the spread at which two certified devices agree.
Reprocessing the same recordings with the current version's code gives 0.8 bpm. These are, however, the recordings the processing was tuned on, made by an earlier version at 24 frames per second, so take it as an optimistic estimate rather than a new measurement.
We added the public BUT PPG dataset to our own study: 3,888 ten-second phone recordings from 50 people, with heart rate from ECG and quality rated by experts. We re-ran the app's code on it.
Ten-second recordings are harder for the app than a normal reading. The experts rated only 21 % of them good; the rest contain motion, strong pressure or a weak signal. That is what we checked the quality grade on.
On the recordings from our own study we also compared heart rate variability and the recovery test, with beats from the ECG as the reference.
Take the variability values as indicative, RMSSD and pNN50 most of all.
The simultaneous data revealed two processing errors we would not have noticed otherwise: the time base in the export ran a quarter too fast, and detection missed every fifth beat. Both are fixed, and new recordings confirmed it. We mention it on purpose: validation is worth doing precisely because it finds errors, and the numbers above hold only after the fix.
Limitations we know of: the sample is small and made up of healthy adults, accuracy depends on signal quality (which is why every reading stores its quality grade), the variability values are indicative, and the 60-frames-per-second version has not yet been validated beat by beat. The app is not a medical device.
The study was approved by the ethics committee of FEKT BUT, with informed consent from all participants. Its anonymised data are free to download.
flutter_tts; over 19,000 lines of code and 140 automated testsfftea library) and
autocorrelationWe publish the data from the validation study in anonymised form, with a data dictionary. Anyone who wants to recompute our numbers with their own method or compare them with their own measurements does not need to ask.
Simultaneous measurement of 15 subjects: heart rate from the phone, from the Bittium Faros 180 Holter ECG and from the Nonin pulse oximeter. CSV format, UTF-8 encoding.
Licence CC BY 4.0: use including commercial, just credit the source. Raw PPG and ECG signals are not part of the dataset; if you need them for your work, get in touch.
In research mode Tepovka saves the whole recording as TXT, CSV or JSON. The data columns are the same in every format:
The file header also holds the measured frame rate and its source, the signal quality grade, the heart rate from pulse onsets, how much the phone moved during the reading (per second in research mode) and all metadata you set for the reading (subject ID, protocol, note).
We time beats from the pulse onset, not the peak: the onset is sharper and comes out more precisely at a phone's frame rate. Readings can also be saved to the Health app; all processing runs locally on the device.
Zelníček, Š., Vavroušek, D., Kovář, J., Kaša, J. (2026). Tepovka — dataset from a validation study of heart rate from a phone camera against ECG. Faculty of Electrical Engineering and Communication, Brno University of Technology. https://mojetepovka.cz
The dataset does not have a DOI yet. We are working on it; until then please cite this page and give the dataset version (1.0, August 2026).
The study was approved by the ethics committee of FEKT BUT, with informed consent from all participants. The data contain no names, ages, sexes or absolute timestamps; subjects appear as pseudonyms P01–P15 and we do not publish the key.
Interested in collaboration, comparative measurements or a student project on this data? Write to info@mojetepovka.cz.
Research mode with metadata and TXT/CSV/JSON export, a measured instead of an assumed frame rate, unified pulse detection timed from onsets, signal quality grading, Health integration, senior mode.
Heart rate from the pulse feet on the result, in the history and while measuring; a clear message when no heart rate can be found; motion watch and longer measuring when the signal is unsettled; quality grading with agreement of two methods; recovery test after exercise; home screen widget. Checked on the public BUT PPG data.
Validating the 60-frames-per-second version against ECG beat by beat, with a larger and more diverse group of participants. Advanced trend analysis and Wear OS integration.
Machine learning for detecting pulses and artefacts, an optional web dashboard for batch analysis. In research: blood oxygen saturation (still being calibrated against a pulse oximeter) and a closer analysis of the pulse wave shape.
What you see on the right is the real app, not a screenshot. A browser cannot see a finger on the lens, so a prerecorded video stands in for the camera. The signal then goes through the same processing as on the phone.
The demo runs the same version 3.3.1 as the app on the App Store. Readings you take in it are stored only in your browser.
Tepovka started in autumn 2024 in the FEKTeams competition at FEKT BUT. The goal is practical measurement of HR and HRV using PPG on ordinary phones, openly and clearly.
We involve students in development, share procedures, and design algorithms that can be further verified in the lab and in the field. The project is supported by the Department of Biomedical Engineering (DBME).
The project is developed and tested at DBME, FEKT BUT. It serves as a training and research framework for PPG and HRV with links to academic resources, labs and internal methodologies.
We are biomedical engineering students working together to advance mobile health and share experience with other science enthusiasts. The project is led by mentors Ing. Jan Šíma and Ing. Andrea Němcová, PhD., and new members are gradually joining us.
Biomedical Engineering
kovar@mojetepovka.czBiomedical Engineering
zelnicek@mojetepovka.czBiomedical Engineering
vavrousek@mojetepovka.czNew member | 1st year BTBIO
kasa@mojetepovka.cz